Content
Cette page est aussi disponible en français
According to a study by the Institut Paris Région published on Thursday April 4, 11.2% of trips in the capital are made by bike, compared with 4.3% by car. Find out more about the seven most popular bike paths.
It's a first-of-its-kind survey carried out by Institut Paris Région. Entitled "GPS Mobility Survey" (EMG), it was carried out between October 2022 and April 2023 among 3,337 Parisians, aged between 16 and 80, who agreed to be equipped with a GPS tracker.
And the first finding of this study, the results of which were published on Thursday April 4, is that Parisians and Ile-de-France residents alike are mobile, especially on weekdays: on average, 34.5 million journeys were recorded per working day in the Paris region. This figure rises to 29 million on Saturdays and 19 million on Sundays. And with good reason: the primary reason for travel for Parisians and Ile-de-France residents alike remains, unsurprisingly, work.
Bicycle growth in figures
- 53,312 bicycle parking spaces have been created since 2020, for a total of 110,754 available spaces (figure as at May 1, 2024).
- 97 bicycle shops have been created since 2020, according to an APUR study. Between 2020 and 2023, this segment saw the strongest growth among retail outlets (+39%).
- 11.2% of trips are made by bike, compared with 4.3% by car
- 97 bicycle shops have been created since 2020, according to an APUR study. Between 2020 and 2023, this segment saw the strongest growth among retail outlets (+39%).
- 11.2% of trips are made by bike, compared with 4.3% by car
11.2% of journeys are made by bicycle in Paris
But what this study reveals is that cycling is really taking over from the car, which is marking time in the capital… and even in the inner suburbs.
According to the study, 11.2% of intramural journeys are now made by bike, compared with just 4.3% by car (in 2010, according to a study by the Institut Paris Région, cycling accounted for just 3% of journeys in Paris…). This proportion is also reflected between Paris and its inner suburbs, thanks in particular to the many cycle paths linking the capital to adjacent communes: 14% of journeys are made by bike, compared with 11.8% by car!
However, walking and public transport remain at the top of the podium, accounting for 53.5% of journeys for the former, compared with 30% for the latter.
The 7 busiest cycle paths in Paris
-
Boulevard de Sébastopol
-
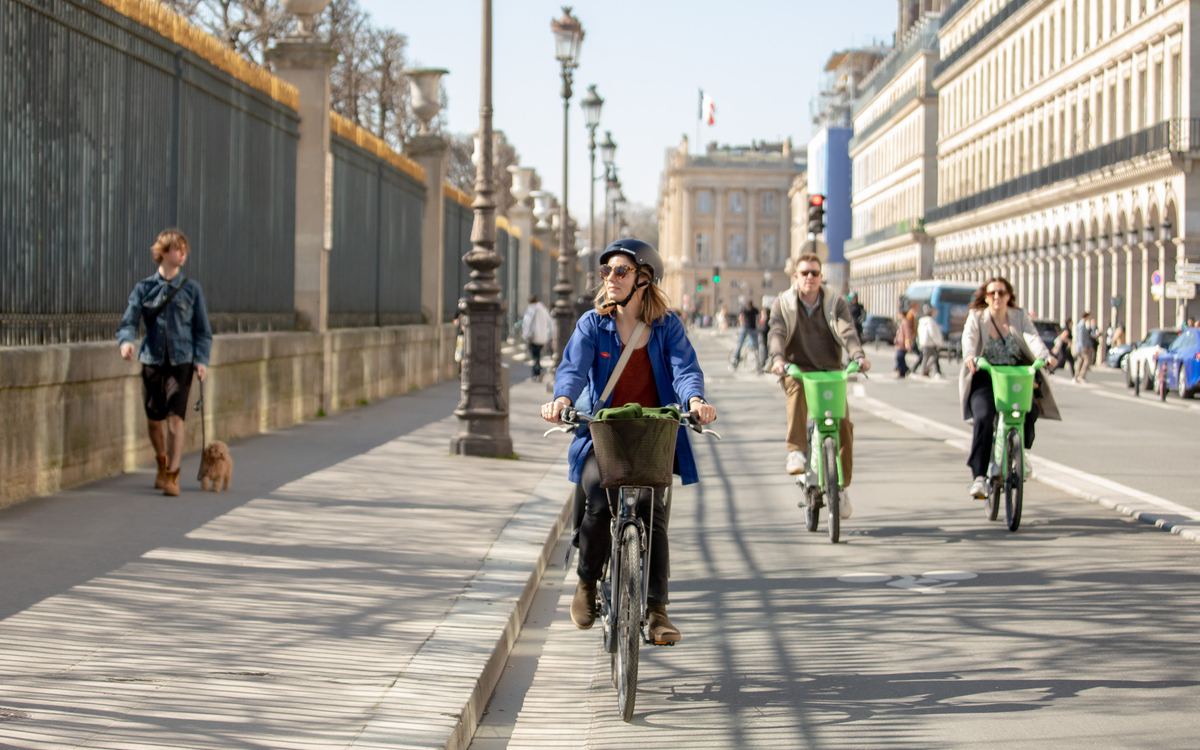
Rue de Rivoli
-
Quai de Valmy et de Jemmappes
-
Boulevard de Magenta
-
Quai d'Orsay
-
Rue Lafayette
-
Avenue de Clichy
Source: City of Paris bicycle meter readings on April 16, 2024
Key figures from the Institut Paris Région study
11.2% of intramural trips are made by bicycle.
4.3% of intramural trips are made by car.
14% of bicycle trips are between Paris and its inner suburbs.
11.8% of car journeys are between Paris and its inner suburbs.
53.5% of trips in Paris are made on foot.
4.3% of intramural trips are made by car.
14% of bicycle trips are between Paris and its inner suburbs.
11.8% of car journeys are between Paris and its inner suburbs.
53.5% of trips in Paris are made on foot.
We want to hear from you!
Was this information useful to you?
Please note: we cannot reply via this form (please do not include any personal information).
